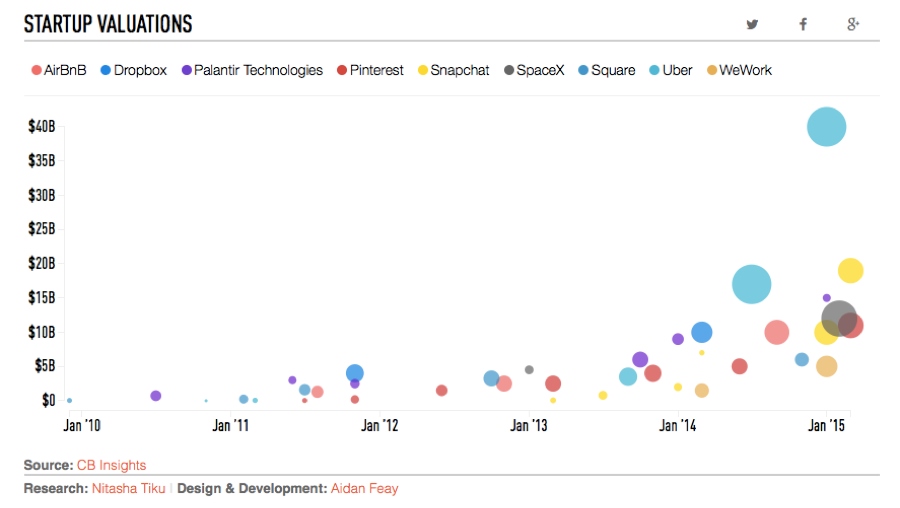
The answer may surprise you, but first a bit of background. There have been signs of financial bubbles throughout global markets: US price/earnings multiples are relatively high, the Chinese equity market is on a tear notwithstanding signs of an economic slowdown, M&A valuations remain near record levels and so on. But, that’s not the whole story.
What is a bubble anyway, you might ask? The simple answer is a bubble occurs when the price of an asset class is bid far beyond its real economic value, typically as a result of mass hysteria, delusion, or misinformation. Bubbles tend to last longer than rational investors anticipate, which is why most short sellers don’t wind up billionaires.
You don’t have to look hard to find recent examples of burst bubbles. Oil is down more than 50% from its 2014 peak. Its drop was even sharper in 2008-2009 when it dropped 65% from peak to trough. Gold, the sure fire inflation hedge, is down almost 40% from its 2011 peak and could still be in a downtrend. These were big events reflecting what has been called the end of the commodity super cycle. Yet both the global and U. S. economies continue to grow.
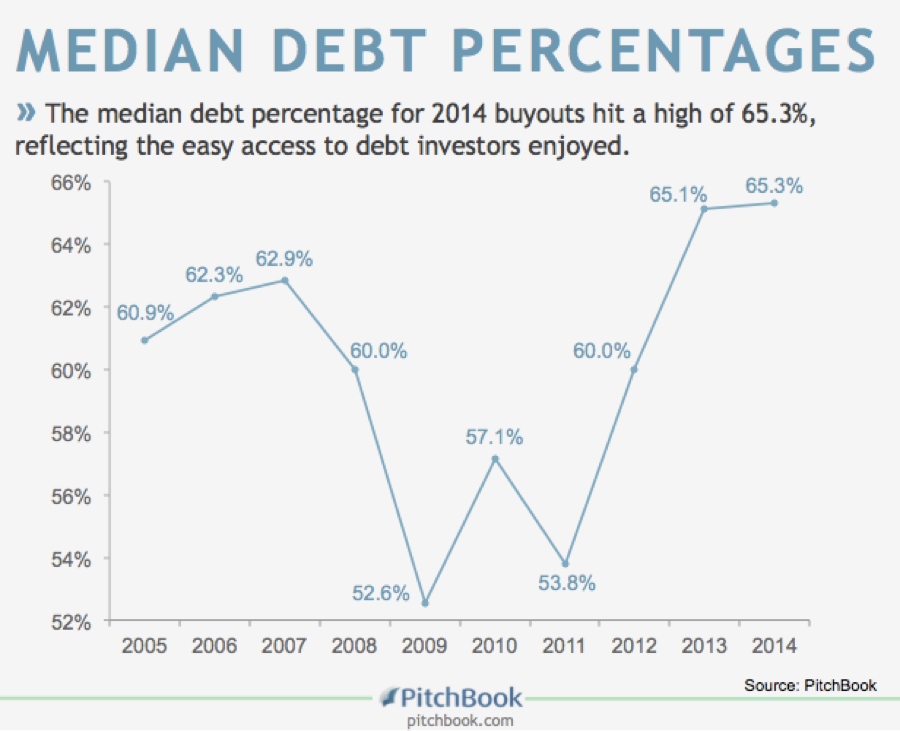
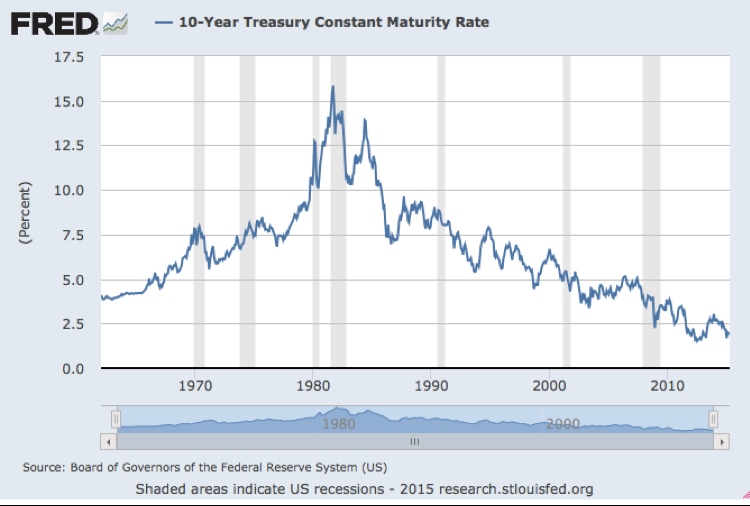
While excess leverage can potentially cause future pain, I would argue that the current M&A leverage and resulting high valuations are a realistic response to the “new normal” of very low interest rates. So long as rates stay low, current valuation levels can hold, or even grow. How does M&A fit into this picture? We’ve written previously about the high valuations seen for profitable middle market companies over the past couple of years. While PE valuations dropped from their 2013 highs, valuation multiples remained near historical highs in 2014. Since that time, 10-year Treasury yields have fallen from 5% to 2%. Lower cost of funding makes it possible for an acquirer to afford more leverage for any particular deal and that is what we have seen. 2013-2014 leverage reached levels not seen even at the 2007 peak.
We would argue that, far from being in a bubble phase, M&A has not fully recovered from the effects of the financial crash with both deal volume and deal value still below 2007 levels. After a long upward run from 1985 to 2000, the M&A market suffered a sharp drop following the Dot Com Crash and 9/11, but quickly recovered to its longer-term trend line by 2007. Since then, the global M&A market has moved sideways at best and is now $2 trillion below the levels predicted by its prior trend line. The higher valuation levels seen in the current market could indicate a bubble mentality, but a strong argument can be made that higher valuations are merely a rational response to historically low interest rates. This market could have a long way to run before it reaches bubble territory.
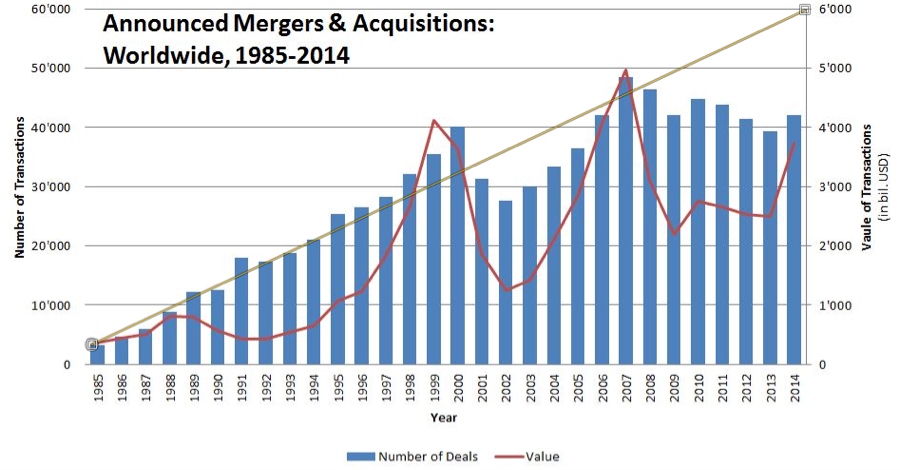
Source: IMAA; Thomson Financial
There are signs that the M&A market could be improving. Dealogic reported that Q1 2015 global M&A volume was the strongest Q1 since 2007. This coincides with our observations in the market. Perhaps this is the year when the dam finally breaks and the M&A market moves back to last decade’s heady levels. If it does, we could have a good run. That’s critically important for the growing numbers of Baby Boomer business owners being pressed by age, health, and lifestyle preferences to consider the sale of their businesses.
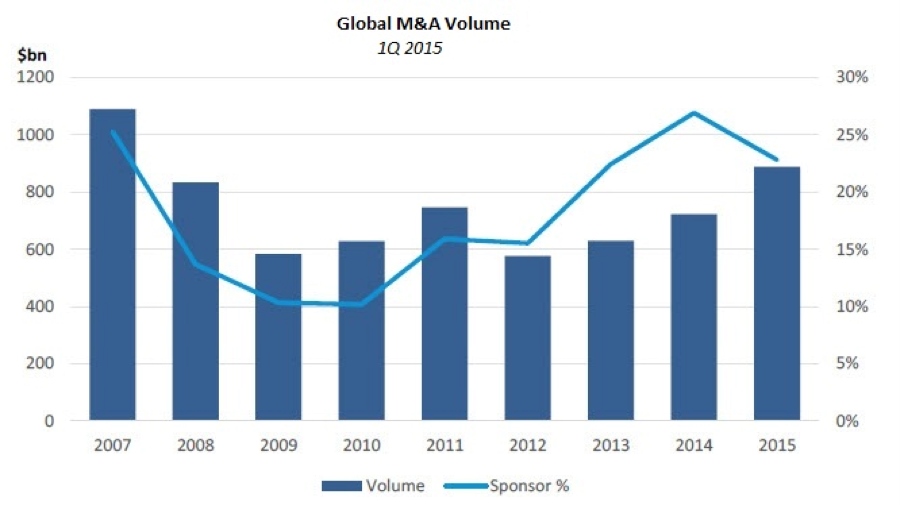
Rational arguments have been made — like in the recent article, It’s a Boom, Not a Bubble – that the economic underpinnings of the current market are far different from those that led up to the Dot Com crash. “This Time is Different” rhetoric notwithstanding, the rapidly expanding private market for tech investments has important elements that contributed to prior crashes, particularly the commitment of large amounts of private risk capital to illiquid investments whose valuations are, in many cases, built around concepts and expectations, not sound economics. However, looked at in the context of a seventeen trillion dollar U. S. economy, the current tech bubble is hardly large enough to pose a serious macro risk.
So, what could upset our happy scenarios of either a long steady increase in M&A demand or a quick, exciting, but ultimately painful, return to the bubble conditions of 2007? The most obvious candidate is global interest rates. Both private and public equity markets depend on the continuation of the longest-lived bull market of our lifetimes. Long-term fixed income securities have enjoyed a positive run that is now approaching its thirty-fourth year, driving 10-year Treasury rates down from almost 16% to current levels under 2%. Investors have lost a great deal of money betting against the downtrend in bond yields.
The risk is growing that we may be reaching the end game for this mother of all bull markets, which has provided the underpinnings for global prosperity in general and the financial industry in particular for decades. I’m not making a prediction of imminent doom, but no trend lasts forever and, when this one turns, the historically high valuations of the current M&A market may fade away as a memory not to be seen again for another generation.
Originally Published on Axial Forum

