
FOCUS Telecom Business Services Quarterly: Spring 2025 Report
Overview
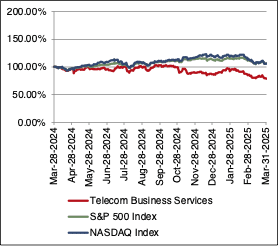
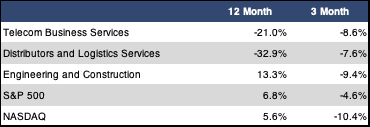
The FOCUS Telecom Business Services Index (TBSI) suffered a steep loss for the second straight reporting period with a three-month drop of 8.6%. This was significantly worse than the 4.6% drop in the S&P 500 over the same time frame, but at least it outperformed the 10.4% decline in the NASDAQ. Over the last twelve months, the TBSI’s performance compares even more unfavorably to the broader indices. While the TBSI fell 21.0% over the past year, the S&P 500 and the NASDAQ gained 6.8% and 5.6%, respectively. Sector multiples are also trading lower than they were in the year-ago period. The revenue multiple for the TBSI fell from 1.2x a year ago to 0.9x currently, while the EBITDA multiple dipped from 12.5x to 9.7x.
Both of the two sub sectors in the TBSI failed to deliver a positive return in our spring reporting period. The Distributors and Logistics Services sub sector was the better performing sub sector with a three-month loss of 7.6%, Declines in this sub sector were broad-based, making this the second straight reporting period where every single stock in the sub sector suffered a negative return. The Distributors and Logistics Services sub sector is also down nearly 33% for the full year, with both revenue and EBITDA multiples declining significantly over this time period. The situation was a bit more nuanced for the Telecom Engineering and Construction sub sector. On the one hand, this sub sector suffered a steeper three-month decline of 9.4%.However, much of this was due to double digit declines at U.S.-based Mastec and Dycom. Companies with more international exposure faired significantly better, although all but one was still in negative territory. In addition, the sub sector also remained in positive territory for the full year with a gain of 13.3%. Sub sector multiples also managed to hold fairly steady compared to this same time last year. The sub sector revenue multiple remained at 0.8x, while the EBITDA multiple declined slightly from 7.3x a year ago to 7.1x currently.
Public Markets Summary
Twelve Month Index Returns
Sector and Sub Sector Returns
Sector and Sub Sector Revenue Multiples

Sector and Sub Sector EBITDA Multiples

M&A Activity
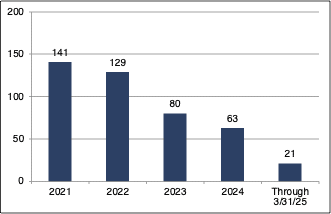
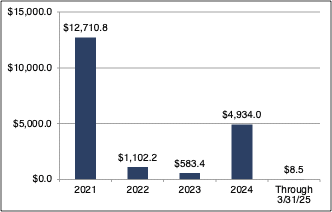
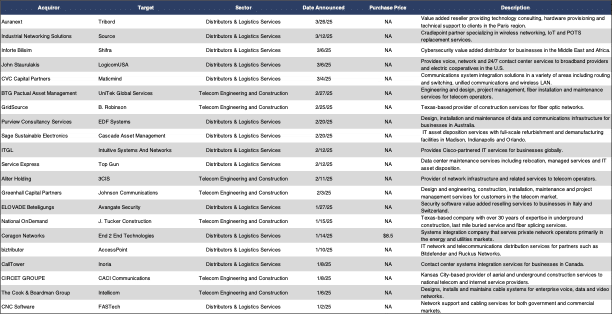
The Telecom Business Services sector maintained its M&A momentum from the last three months of 2024, at least when measured by the total number of announced transactions. The first three months of 2025 had a total of 21 announced deals, which is a much higher level of activity than we saw for most of 2024. On the down side, total announced transaction dollar value for the past three months came in at a paltry $8.5 million.We saw activity pick up in the Telecom Engineering and Construction sub sector as it accounted for seven of the period’s total transactions. This included a new private equity-backed platform as Greenhall Capital Partners acquired Texas-based fiber engineering and construction company Johnson Communications. In another Texas-based deal, National OnDemand acquired J. Tucker Construction.Finally, we noted that fiber engineering and construction company UniTek Global Services was acquired by BTG Pactual Asset Management. The Distributors and Logistics Services sub sector also had a newly minted platform company with the CVC Capital Partners acquisition of Maticmind, a technology distributor based in Italy. ITAD service provider Sustainable Electronics notched another acquisition with its purchase of Cascade Asset Management. We also noted that John Staurulakis acquired LogicomUSA, a provider of contact center support solutions to smaller broadband operators. In the final transaction in the Distributors and Logistics Services sub sector that we will specifically highlight, Service Express was once again active this period with its acquisition of data center maintenance services provider Top Gun.
There was only one transaction with an announced multiple this period. This was the Ceragon Networks acquisition of distributor and systems integration company End 2 End Technologies. This transaction had a revenue multiple of 0.6x.There was no announced EBITDA multiple.
Number of Transactions
$ Value of Transactions in Millions
Announced Transactions (1/1/25 – 3/31/25)
Announced Transactions with Revenue Multiples (4/1/24 – 3/31/25)

DOWNLOAD THE FULL REPORT HERE.


